2008 Trade Show Expenses Report
In last month's issue of Trade Show Tips we asked you to take a moment to reply to our survey of how your trade show dollars are being spent. The survey drew close to 2,100 responses and we thank you for taking the time to help us complete this interesting and useful project.
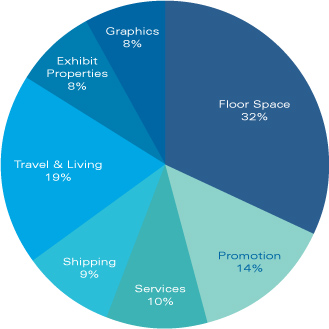
The chart below shows the overall results - in terms of their percentages - that each category claims in the total exhibiting program budget.
Trade Show Budget by Expense Category
Within the survey, each category was provided with a brief explanation. Here are the elaborated categories:
- Floor Space: cost of booth space
- Promotion: collateral materials, advertising and giveaways
- Services: installation & dismantle, booth cleaning, lead tracking and drayage
- Shipping: freight charges
- Travel & Living: travel, lodging, meals and entertainment
- Exhibit Properties: design, build, refurbishment, rental, storage, pull & preparation and taxes
Respondents were asked to provide the percentage each category represented within their entire trade show budget.
The two largest categories, Floor Space and Travel & Living, continue to dominate as in the past and their share is unchanged. The biggest changes came in Promotion that has more than doubled its share since the last period studied and Exhibit Properties and Services that have each lost an equal share of budget to Promotion. Exhibitors are investing lots more to get attendees not just to the show, but into their booth.
Part of the information that was collected was 1) booth size and 2) number of shows that the respondents took part in each year. Using this information we are able to look at some differences in the budgets that exist for the various sizes and levels of activity. Of the two, booth size is the greater source of variation.
Not too surprisingly the proportion of budget going to Shipping and Services grows dramatically between the smaller exhibits and the large spaces, 14% versus 23% combined totals respectively. Likewise, the cost of the Exhibit Properties themselves account for twice as much of the large exhibitors' budgets compared to the 10-foot space: 12% versus 6%.
The profile of our overall respondent pool revealed that just under 40% regularly used a 10-foot space, around 30% were in larger backwall exhibits and about 30% were in island spaces. We found that nearly 70% exhibited at 10 or fewer shows per year.
Thank you all for taking the time to help make this survey a success.